
Most companies waste 5–10% of their budget on unnecessary spending. The problem isn’t always obvious-it hides in departmental silos, outdated contracts, and processes nobody questions.
A cost savings analysis reveals where that money goes and how to get it back. We at The Pledge built this guide to walk you through a systematic approach that actually works.
Define Your Scope and Objectives
Starting a cost savings analysis without clear boundaries wastes time and resources. You need to pick specific areas first, set measurable goals, and define your analysis period. Most companies fail at this step because they either aim too broad or too narrow. Broad analysis paralyzes teams with too much data. Narrow analysis misses the hidden waste in overlooked departments.
Pick Your Focus Areas
The sweet spot is selecting 2–4 functional areas that consume the largest share of your budget. For example, if labor costs represent 40% of your expenses, IT infrastructure represents 15%, and procurement represents 12%, focus your initial analysis on those three. This approach gives you the highest probability of finding meaningful savings without drowning in data collection.
Set Concrete Reduction Targets
Vague goals like “lower costs” lead to vague efforts. Instead, set a specific reduction target like 8–12% of current spending in those areas. A concrete goal of reducing labor costs by 10% over 12 months, or cutting procurement spend by 8% within six months, creates accountability and helps you measure progress.
Choose the Right Time Horizon
The timeframe matters significantly because spending patterns across fiscal periods shift seasonally. A three-month analysis might miss annual contract renewals or seasonal hiring surges. A five-year analysis becomes unreliable because too many variables change. Most companies find the sweet spot at 12 months of historical data, which captures normal business cycles while remaining accurate enough to act on.
Gather Your Baseline Data
Before you analyze anything, pull 12 months of actual spending records from your accounting system, procurement platform, and payroll records. Organize this data by department, cost category, and vendor. The granularity matters because a vague category like “operations costs” obscures specific inefficiencies. When you break operations into facilities, maintenance, supplies, and utilities, patterns emerge. One organization discovered they were paying three different vendors for nearly identical office supplies at vastly different prices, representing 6% waste in procurement alone. You cannot spot that without detailed categorization. Document your baseline cost analysis clearly because this becomes your benchmark for measuring savings later. If you claim a 10% reduction without a clear baseline, stakeholders will not believe you.
With your scope defined and baseline established, you now have the foundation to move forward. The next step involves organizing this data strategically so you can identify where waste actually hides.
Organize Your Data to Surface Hidden Waste
Most companies collect spending data but fail to organize it effectively, which means waste remains invisible. You need to pull 12 months of transaction-level data from every system where money leaves your organization-accounting software, procurement platforms, payroll records, and vendor invoices. Export this into a single spreadsheet or database rather than analyzing fragmented sources. One manufacturer discovered they were paying four different vendors for nearly identical raw materials at prices ranging from $8 to $14 per unit, but only found it after consolidating procurement data across three separate systems. That oversight cost them roughly 18% in unnecessary spend on that category alone.
The granularity of your data determines what you can actually see. A line item labeled “supplies” tells you nothing. Breaking it into office supplies, janitorial supplies, IT equipment, and maintenance materials reveals specific cost patterns. When you track which departments ordered what, you uncover duplicate vendors, bulk-buying opportunities, and departmental inefficiencies that would otherwise stay hidden.
Assign Costs to Clear Categories
Create a categorization system that matches how your business actually spends money. Standard categories include labor (salaries, contractors, overtime), procurement (materials, equipment, services), facilities (rent, utilities, maintenance), technology (software licenses, hardware, cloud services), and professional services (consulting, legal, accounting). Within each category, subdivide further. For technology, separate SaaS subscriptions from infrastructure costs from support contracts.
This structure lets you compare spending across departments and identify where similar costs vary wildly. When one department pays $120 per user annually for project management software while another pays $80 for nearly identical functionality, you have found a consolidation opportunity. Track vendor names and contract dates too, because contracts expiring within your analysis period represent immediate renegotiation opportunities. Most vendors expect 10–20% price reductions during renewal discussions if you approach with competitive quotes. Document your categorization logic clearly so that anyone reviewing your analysis understands how costs flow into each bucket.
Calculate What You’re Actually Spending
Take your categorized data and sum total spending by category and department for each month across your 12-month period. Calculate the monthly average and annual total for each category. This baseline becomes your measurement stick for all future comparisons. If procurement currently costs $2.4 million annually, an 8% reduction target equals $192,000 in potential savings. That concrete number guides your search efforts and helps you prioritize where to focus.
Compare spending across departments for similar functions. If marketing pays $15,000 annually for graphic design software while design pays $8,000 for the same tool, you have identified waste. Calculate what percentage of total spending each category represents. When labor represents 62% of costs, IT represents 18%, and everything else splits the remaining 20%, you know where big savings typically hide. These ratios also help you set realistic reduction targets. Cutting labor costs by 5% is more achievable than cutting facility costs by 30% when facilities already operate at minimal overhead.
Prepare for the Next Phase
Your organized data now sits ready for analysis. The spending patterns you have uncovered-duplicate vendors, contract renewal dates, departmental variations, and category breakdowns-form the foundation for identifying specific opportunities. With this clarity, you can move forward to pinpoint exactly where waste hides and calculate the financial impact of addressing it.
Where Waste Actually Hides
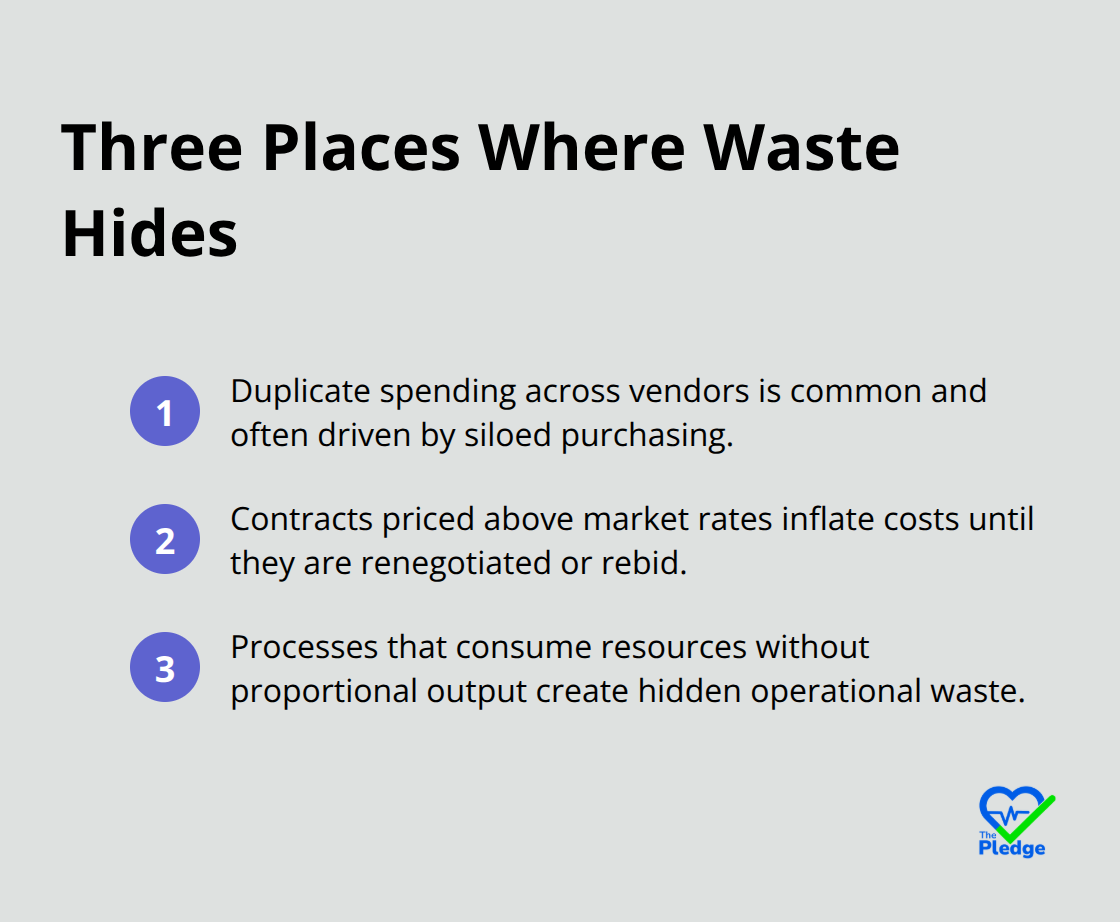
Your organized data reveals spending patterns, but spotting actual waste requires a different approach. Waste lives in three specific places: duplicate spending across vendors, contracts priced above market rates, and processes that consume resources without proportional output.
Find Duplicate Spending Across Vendors
Start by searching for identical or near-identical services purchased from different vendors. When your finance department pays vendor A $85 per month for accounting software while your operations team pays vendor B $120 for the same platform, that $420 annual difference per user represents pure waste. Run targeted searches through your data to identify these overlaps.
Most organizations discover that 15–25% of their software and service spending involves redundant tools across departments. One financial services firm found they maintained seven different project management platforms across nine departments, each with overlapping functionality. Consolidating to two platforms saved them $180,000 annually while actually improving team collaboration.
Target Contracts Approaching Renewal
Identify all contracts expiring within your analysis period. Contracts nearing renewal represent your highest-leverage opportunities because vendors expect negotiation and typically offer 10–20% reductions when presented with competitive quotes. Research current market pricing using procurement benchmarking data or competitive quotes from at least two alternative vendors. If your current software contract costs $150,000 annually and market research shows competitors charge $125,000 for equivalent functionality, your realistic savings target is $25,000 annually assuming you renegotiate successfully. Document the contract end dates and current pricing for every major vendor. This simple step often reveals that your organization pays renewal rates significantly higher than what new customers receive for identical services.
Investigate Departmental Spending Anomalies
Look for departments that spend 40% more than others performing similar functions. Sometimes the difference reflects legitimate needs, but often it signals outdated pricing, poor vendor management, or simple ignorance of better alternatives elsewhere in your organization. When five departments perform similar functions but one spends substantially more, investigate why. A manufacturing company discovered their eastern regional office paid 35% more for identical raw materials than their western office, simply because the regional manager had never compared vendors. Fixing that single anomaly saved $240,000 annually.
Quantify Savings with Confidence Levels
Quantifying savings requires matching each waste opportunity to a specific dollar amount and confidence level. For duplicate vendors, the math is straightforward: calculate the price difference multiplied by annual volume. If you consolidate three office supply vendors into one and save $8 per transaction across 500 annual transactions, that equals $4,000 in identifiable savings. Assign confidence levels to each opportunity: high confidence (90–100%) for consolidation savings with clear pricing, medium confidence (60–80%) for renegotiation savings pending successful vendor discussions, and low confidence (30–60%) for process improvements requiring organizational change. Present your total savings potential in three scenarios: conservative (counting only high-confidence items), realistic (mixing high and medium confidence), and optimistic (including all opportunities). Most organizations should pursue the realistic scenario, which typically captures 70–80% of total potential without requiring heroic execution.
Prioritize Opportunities by Impact and Effort
Prioritize opportunities by dividing potential savings by implementation effort. A $50,000 savings requiring two weeks of procurement work scores higher than a $40,000 savings requiring three months of process redesign. Quick wins like vendor consolidation and contract renegotiation should launch first because they build momentum and deliver cash savings within 90 days, demonstrating that your analysis actually works.
Final Thoughts
Your cost savings analysis now sits complete with concrete opportunities identified, quantified, and prioritized. Start with your highest-impact, lowest-effort opportunities first because vendor consolidation and contract renegotiation typically deliver 60–70% of your total savings potential while requiring minimal organizational disruption. These quick wins build credibility and momentum for larger process improvements that take longer to implement.
Implementation requires clear ownership and accountability. Assign specific people to each opportunity with defined timelines and success metrics-a procurement manager owns vendor consolidation, your finance team owns contract renegotiation, and your operations leader owns process improvements. Monitor results monthly against your baseline and track actual savings realized versus projected savings for each opportunity to prevent teams from claiming savings that never materialized.
Most organizations capture 70–80% of identified savings within the first year when they maintain focus and accountability. The remaining 20–30% typically requires deeper process changes that take longer to implement but deliver sustained savings year after year. The Pledge helps employers reduce healthcare spending through preventative care coordination and centralized health data, complementing your broader cost reduction strategy.
![[Guide] Incentives That Drive Preventive Health Participation](https://thepledge.app/wp-content/uploads/emplibot/Guide_-Incentives-That-Drive-Preventive-Health-Participation_1783650286-300x168.jpeg)