

Digital health platforms generate massive amounts of data about employee health behaviors and outcomes. Yet most employers struggle to translate that data into clear financial returns.
At The Pledge, we’ve seen firsthand that benefits budgeting analytics transforms raw health data into concrete ROI forecasts. This guide shows you exactly which metrics matter, how to establish baselines, and how to present the business case to your leadership team.
What Benefits Budgeting Analytics Actually Measures
Benefits budgeting analytics tracks three distinct layers of value that digital health platforms create for employers. The first layer is financial: direct medical cost reductions, pharmacy savings, and avoided procedures. The second is operational: productivity gains, reduced absenteeism, and lower disability claims. The third is behavioral: employee engagement rates, care adherence, and early intervention adoption. Most employers focus only on the first layer and miss substantial ROI hiding in the other two.
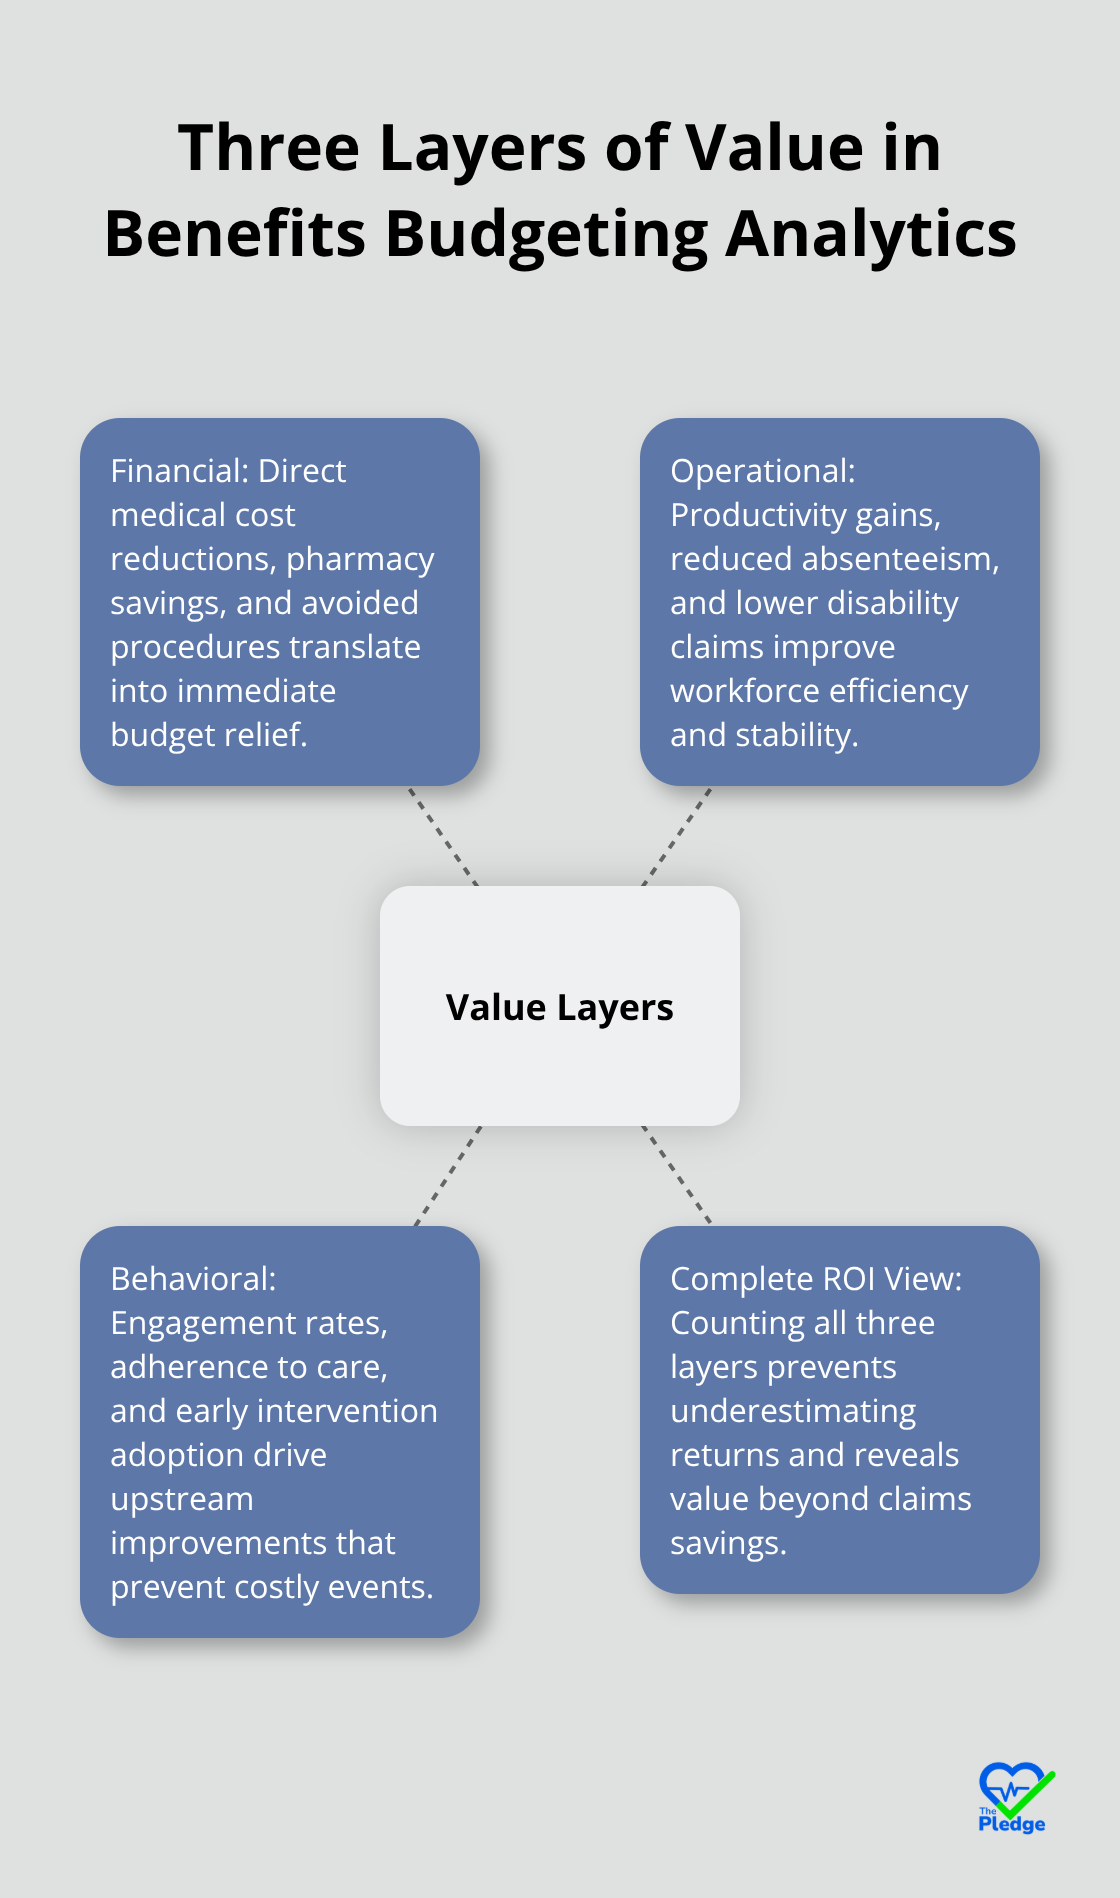
According to the United States Bone and Joint Initiative, unmanaged health conditions drive indirect workforce costs through absenteeism and lost productivity that often exceed direct medical spending. Your ROI forecast is incomplete if you only count what you save on claims.
The data your platform should generate
Digital health platforms produce usable data in real time, not quarterly reports. These systems centralize health information through AI-driven technology that tracks employee interactions with care resources, adherence to treatment plans, and outcomes from preventative interventions. This continuous flow of data allows you to measure engagement rates immediately-not months later when claims data arrives. Engagement is the leading indicator of ROI. According to npj Digital Medicine research, digital MSK programs achieve higher completion rates for traditional in-person physical therapy. Higher completion directly predicts cost savings because employees who complete treatment avoid expensive downstream interventions like imaging, injections, and surgery. Your platform should feed you weekly or monthly dashboards showing adoption trends, not annual summaries.
Why forecasting ROI before you see results matters
ROI forecasting lets you predict financial impact within months rather than waiting for annual claims data to arrive. Industry analysis shows that time-to-value for digital health programs can be measured in months, not years, which means you can validate your investment quickly and adjust strategy if needed. Employers who establish baseline metrics before implementation-documenting current MSK claims, disability trends, and productivity losses-can then compare actual outcomes against those baselines within 90 days. This matters because healthcare budgets are volatile. Spend volatility often hinges on a small number of high-severity claims, complicating forecasting. A digital platform with predictive analytics can identify employees at high risk for costly events ahead of actual claims, enabling earlier intervention. When predictive targeting is applied to high-risk populations, ROI can reach up to 4.4x according to Risk Strategies Consulting. That’s not theoretical-it’s the difference between reactive spending and controlled budgets.
How to move from data to actionable forecasts
The transition from raw data to ROI projections requires three steps. First, establish your baseline by pulling 12 months of historical claims, disability, and productivity data before you launch your platform. Second, define your target metrics: which outcomes matter most to your organization (cost reduction, absenteeism, engagement)? Third, set realistic timelines for measurement. Most employers see meaningful signals within 90 days and validated ROI within six months.
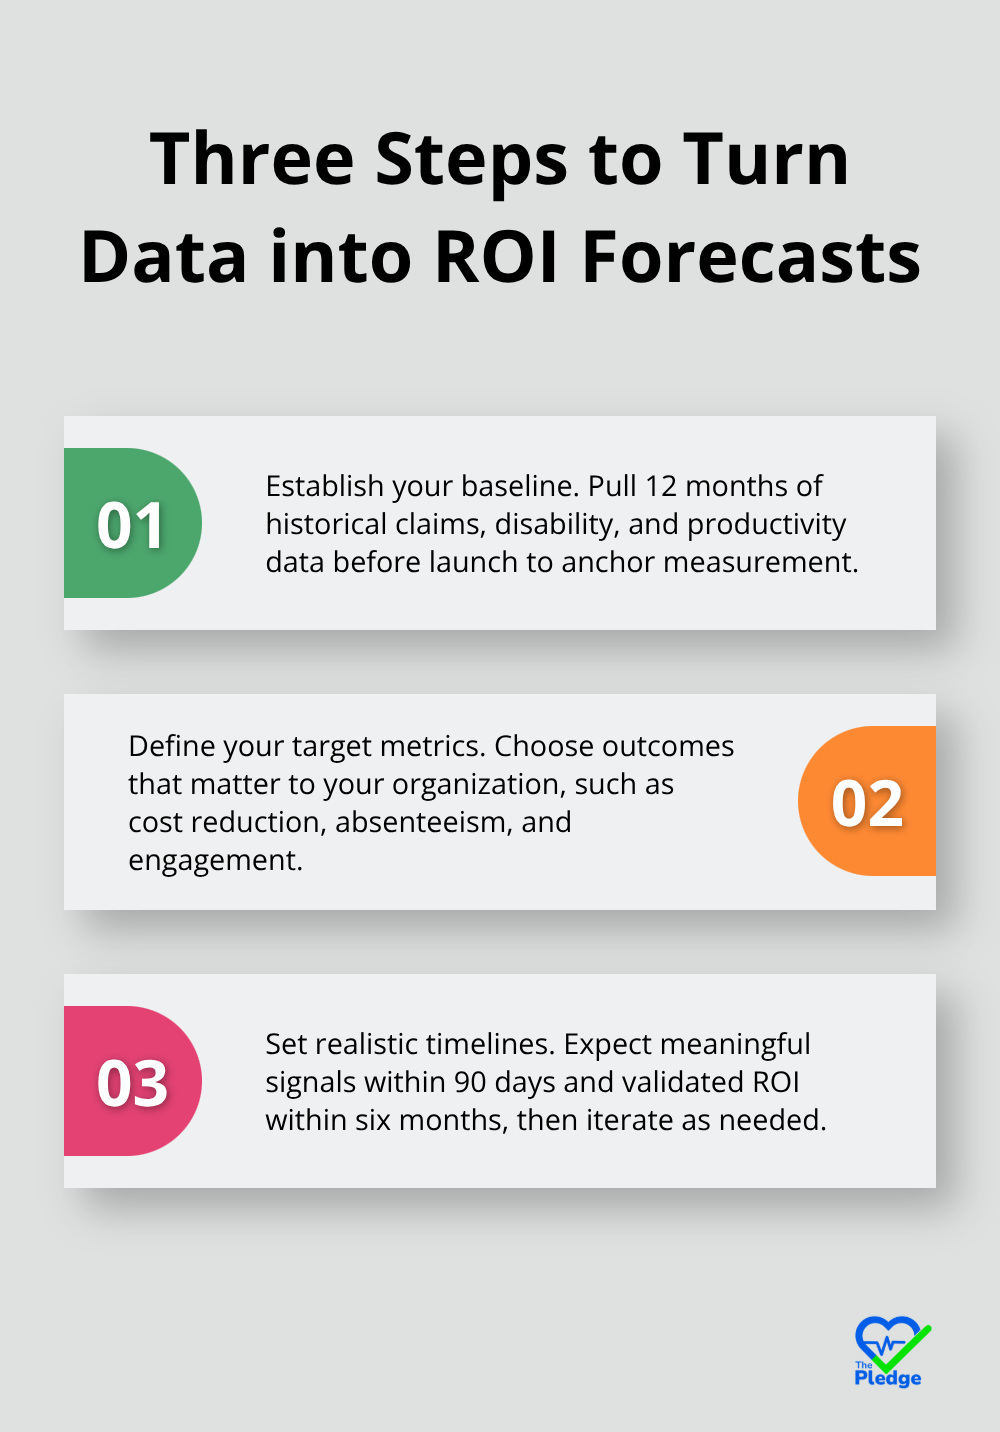
This approach transforms benefits budgeting from a backward-looking exercise into a forward-looking tool that shapes your health strategy.
Which Metrics Actually Drive ROI
Completion rates matter more than login counts
Engagement rates sound important until you realize that an employee using your platform is meaningless if they’re not improving their health or reducing costs. We focus on metrics that connect directly to financial outcomes, not vanity numbers. Completion rates matter far more than login counts. Research from npj Digital Medicine shows that digital MSK programs achieve 81% completion rates compared to roughly 50% for traditional in-person physical therapy. That completion gap translates directly into cost avoidance because employees who finish treatment avoid imaging, injections, and surgery.
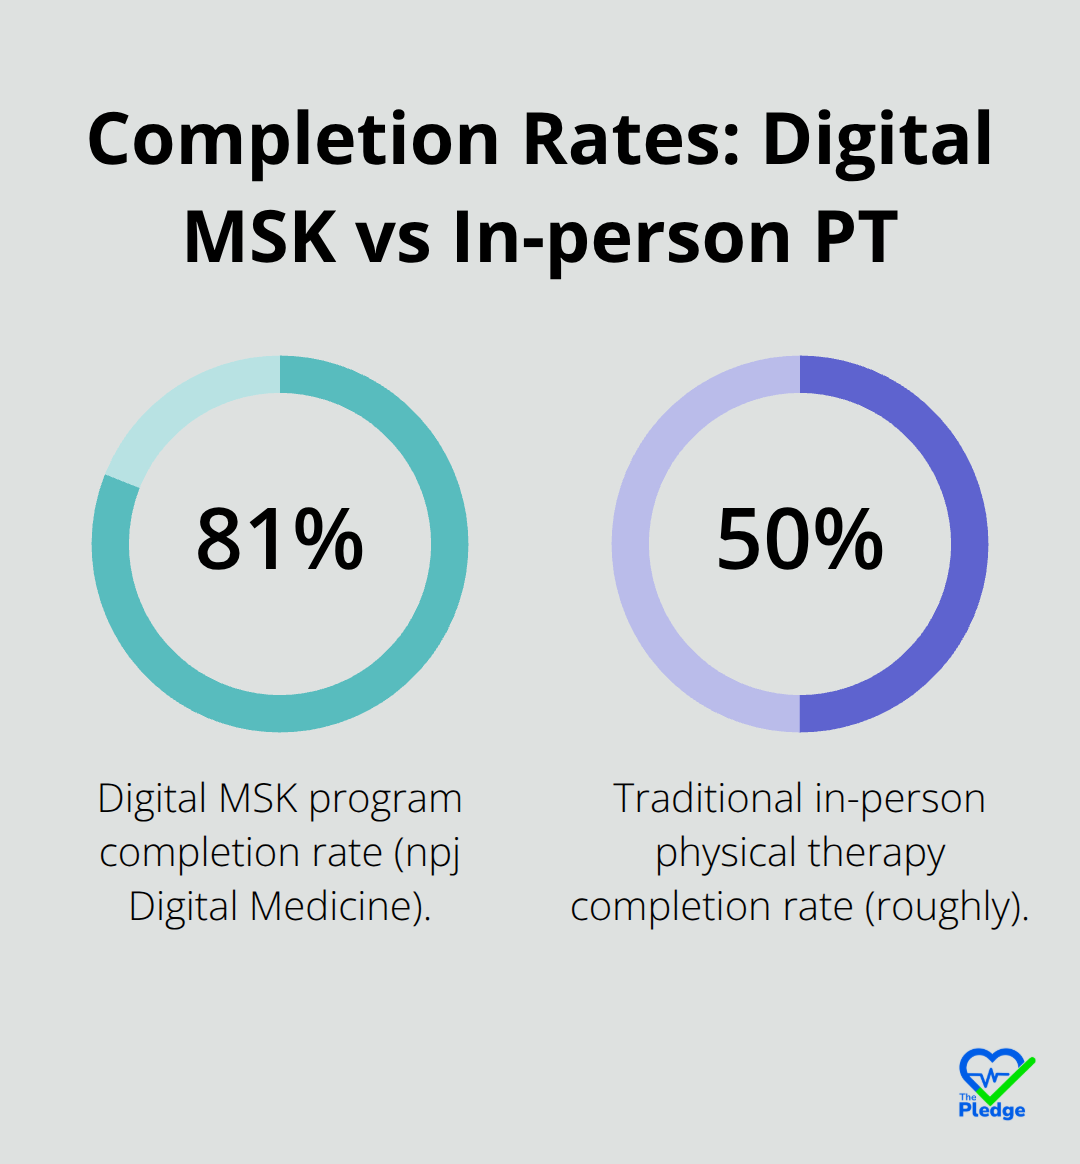
Track what percentage of employees who start a health intervention actually complete it within your target timeframe. If your completion rate sits below 70%, your engagement strategy isn’t working regardless of how many people log in. Adoption speed also matters more than total adoption. Employers who see 40% of their at-risk population enrolled in preventive interventions within the first 90 days typically report meaningful ROI signals faster than those who chase 100% adoption over 12 months. Early movers in any health program create the strongest outcomes because they prevent deterioration before conditions become expensive.
Segmenting claims data by condition type
Healthcare cost reduction requires baseline discipline before you can measure it. Pull your claims data for the past 12 months and segment it by condition type, specifically separating musculoskeletal conditions, mental health, and chronic disease because digital platforms impact each differently. Employers using predictive analytics see ROI reach 4.4x compared to universal programs. This means your platform should identify which 20% of your population drives 80% of your costs, then measure whether that group shows cost reductions within six months.
Three metrics that reveal real financial impact
Productivity gains appear in absenteeism data and short-term disability claims, not in subjective wellness surveys. A validated ROI of 3.2:1 with average MSK cost savings over 3x demonstrates what structured measurement looks like. Absenteeism reduction of 39% in lost workdays, as reported by Risk Strategies Consulting, translates into concrete dollar value when you calculate the average loaded salary cost per absent day. If your average employee costs $150 per day in lost productivity and you reduce absenteeism by 5%, that’s measurable financial impact.
Surgical claim reductions of roughly 50% occur when digital programs catch musculoskeletal issues early, preventing expensive procedures. Measure these three metrics monthly rather than annually: claims costs by category, absenteeism rates by department, and disability duration. Monthly tracking reveals whether your platform is working within 90 days, not waiting for year-end data to discover failure.
Moving from metrics to predictive forecasting
The metrics you track today become the foundation for predicting tomorrow’s costs. When you establish monthly baselines across completion rates, claims segmentation, and absenteeism, you create the data foundation that predictive analytics requires. Your platform should flag which employees show early warning signs-missed appointments, incomplete interventions, or rising symptom severity-before they generate expensive claims. This forward-looking approach shifts your role from reactive cost manager to proactive cost preventer, which is where the highest ROI emerges.
Building Your ROI Forecast From Real Data
Establish baselines before your platform launches
Accurate ROI forecasting starts with discipline, not optimism. Most employers fail at this stage because they skip the foundational work of establishing baselines before your digital platform launches. You cannot measure impact without knowing where you started. Pull 12 months of historical claims data, disability records, and absenteeism logs before implementation begins. Segment this data by condition type, department, and cost tier because your digital platform will impact high-cost musculoskeletal conditions differently than mental health or chronic disease management.
According to Risk Strategies Consulting, when predictive targeting focuses on high-risk populations rather than universal programs, ROI reaches 4.4x compared to broader approaches. This means your baseline should identify which 20% of your population generates 80% of your costs, then track whether that specific group shows measurable improvement within 90 days. Document three baseline metrics with precision: total medical spend by condition category, average absenteeism days per employee per month, and short-term disability claim frequency. These numbers become your measurement standard. Without them, you’re guessing whether your platform works.
Use predictive analytics to project future costs
Predictive analytics transforms historical patterns into forward-looking cost projections. Once your platform collects real engagement data-completion rates, intervention adherence, early warning signals-feed that information into models that project future claims reductions. Predictive analytics can cut readmissions by as much as 25%, cut emergency department visits by 15%, and save 12% in labor costs, which means you should see early ROI signals within 90 days if your platform architecture is sound.
Compare your actual outcomes against industry benchmarks published by the United States Bone and Joint Initiative and Risk Strategies Consulting. Early MSK intervention can reduce direct medical costs through avoided imaging, injections, and surgeries according to research from Magel and colleagues. A validated ROI of 3.2:1 with average cost savings exceeding 3x demonstrates what realistic performance looks like when programs achieve high completion rates.
Account for three categories of cost avoidance
Your forecasting model should account for three distinct cost avoidance categories: direct medical savings from avoided procedures, indirect savings from reduced absenteeism and disability, and productivity gains from employees returning to full function faster. Many employers underestimate the indirect costs-a 39% reduction in lost workdays translates into substantial dollar value when multiplied by your average loaded employee cost.
Direct medical savings emerge when digital platforms catch conditions early, preventing expensive downstream interventions. Surgical claim reductions of roughly 50% occur in mature programs that identify musculoskeletal issues before they require procedures. Indirect savings accumulate through reduced disability duration and fewer absent days, which compounds across your entire workforce. Productivity gains represent the third layer: employees who complete treatment interventions return to full capacity faster, eliminating the performance drag that chronic pain or untreated conditions create.
Set conservative benchmarks for credibility
Set benchmarks conservatively. If industry data shows 50% surgery reductions in mature programs, try reaching 35% in year one unless your population has exceptional engagement. This prevents overselling your business case to leadership and delivers credible results that build confidence in ongoing digital health investment. Conservative forecasting also protects your budget from volatility-healthcare spend often hinges on a small number of high-severity claims, so your projections should account for this unpredictability rather than assume linear cost reductions.
Final Thoughts
The business case for digital health investment rests on three pillars: financial returns, operational efficiency, and employee engagement. When you establish baselines before implementation, track completion rates instead of login counts, and segment claims data by condition type, you transform benefits budgeting analytics into a forward-looking tool that shapes strategy. Most employers see meaningful ROI signals within 90 days and validated returns within six months when they measure the right metrics.
Presenting ROI data to stakeholders requires translating raw metrics into dollar values that resonate with your leadership team. Show them the three-layer value proposition: direct medical savings from avoided procedures, indirect savings from reduced absenteeism and disability, and productivity gains from faster employee recovery. A validated ROI of 3.2:1 with average cost savings exceeding 3x demonstrates what realistic performance looks like when you segment your high-risk population and track whether that group shows measurable improvement.
Your next step is selecting a platform that generates real-time data, not quarterly reports. The Pledge centralizes health data through AI-driven technology that tracks employee engagement, intervention adherence, and early warning signals immediately. Start with your baseline metrics, define your target outcomes, and measure progress monthly-this disciplined approach transforms digital health from a wellness initiative into a measurable business investment.





![[Guide] Incentives That Drive Preventive Health Participation](https://thepledge.app/wp-content/uploads/emplibot/Guide_-Incentives-That-Drive-Preventive-Health-Participation_1783650286-300x168.jpeg)