
Healthcare organizations waste billions annually on inefficient spending and missed opportunities. At The Pledge, we’ve seen firsthand how strategic cost management unlocks both cost savings plus measurable ROI.
This guide walks you through identifying where your money goes, implementing proven cost-reduction strategies, and tracking the financial impact that matters.
Where Your Healthcare Spending Actually Goes
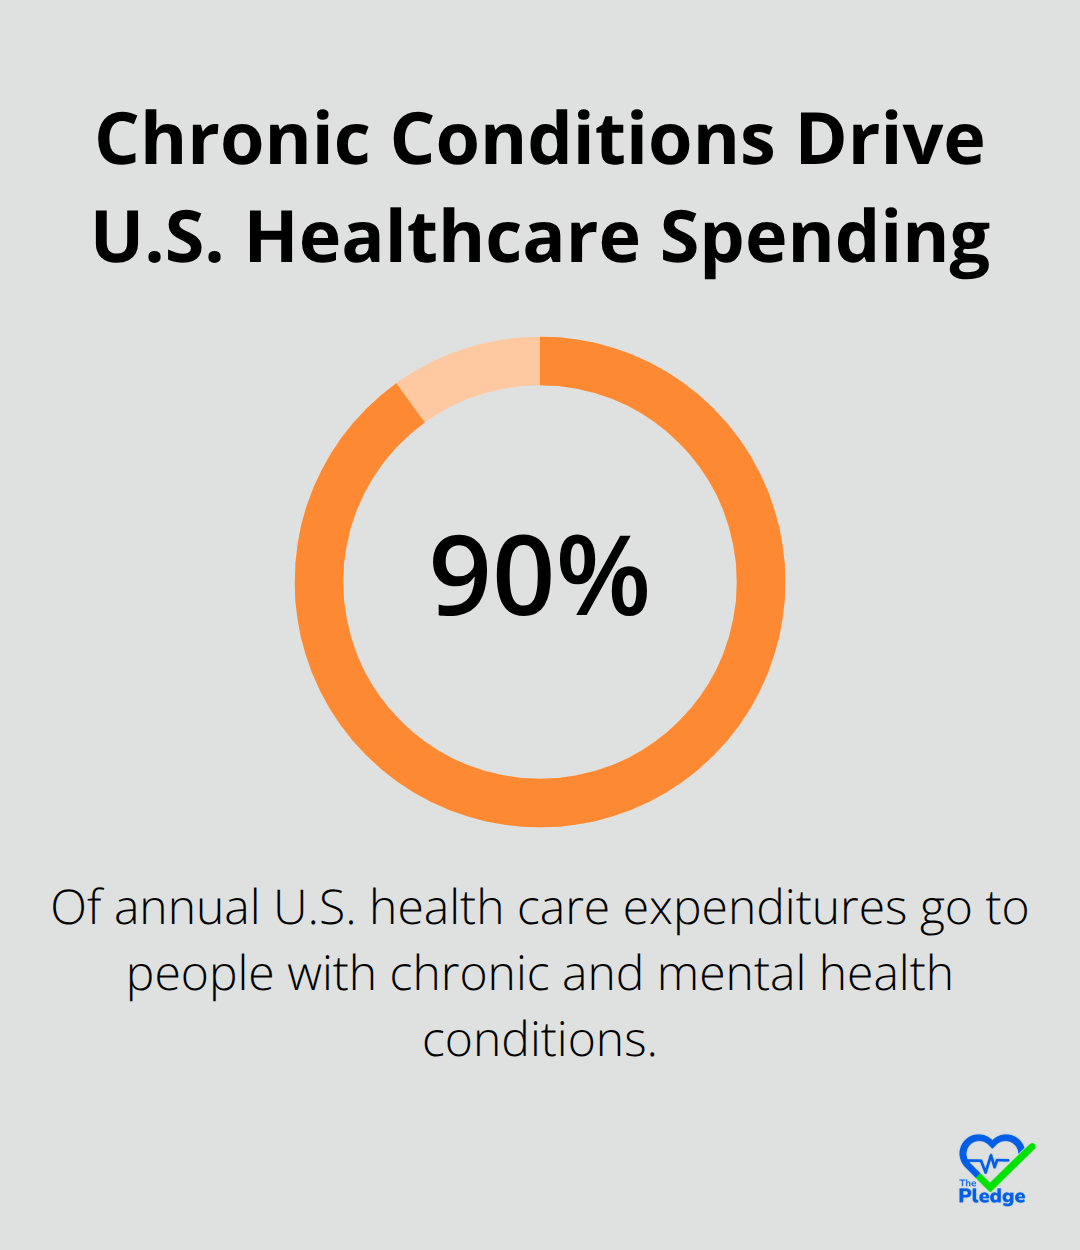
Healthcare organizations operate blind to their true cost drivers. Most finance teams track spending at a high level-salaries, claims, benefits-but lack visibility into the specific patterns that generate waste. Organizations that start by auditing their claims data in detail often find shocking results. Ninety percent of the nation’s $4.9 trillion in annual health care expenditures are for people with chronic and mental health conditions. This concentration means targeted interventions on high-cost populations deliver disproportionate savings.
Extract and Categorize Your Claims Data
Start by extracting twelve months of claims data from your payroll or benefits administrator and categorize spending by employee, condition, service type, and provider. Look for outliers: employees with multiple emergency room visits, repeated hospitalizations, or specialist referrals that cluster around preventable diagnoses like uncontrolled diabetes or hypertension. These patterns reveal where your organization bleeds money and where intervention pays back fastest. The data tells a story-one that most organizations never read because they lack the discipline to organize it properly.
Compare Yourself to Industry Benchmarks
Industry benchmarks provide critical context, but they’re often stale or too broad to guide action. The Healthcare Cost and Utilization Project, a federal research initiative, publishes anonymized claims data showing average spending by condition and demographic. Pull your own metrics against these benchmarks: if your preventive care costs per employee fall short of the national average, you’ve identified a gap worth closing. Regional variation matters too-care costs in rural areas often differ sharply from urban centers, so compare yourself to peers in your geography and industry.
Identify Utilization Gaps That Signal Broken Processes
Benchmark not just total spend but also utilization rates. If your emergency room visit rates run higher than comparable organizations, that signals primary care coordination or after-hours access problems. These gaps reveal root causes, not symptoms, and cost-reduction strategies gain traction when they address root causes. Organizations that skip this step waste resources on generic wellness programs that fail to address their actual cost drivers.
Use Data to Design Targeted Interventions
Once you understand your spending profile and how it compares to peers, you can design interventions that move the needle. The organizations that succeed at cost reduction don’t start with broad wellness initiatives-they start with the data that shows exactly where money flows and why. This foundation positions you to implement strategies that actually work, which we explore in the next section.
How to Turn Spending Data Into Real Cost Reductions
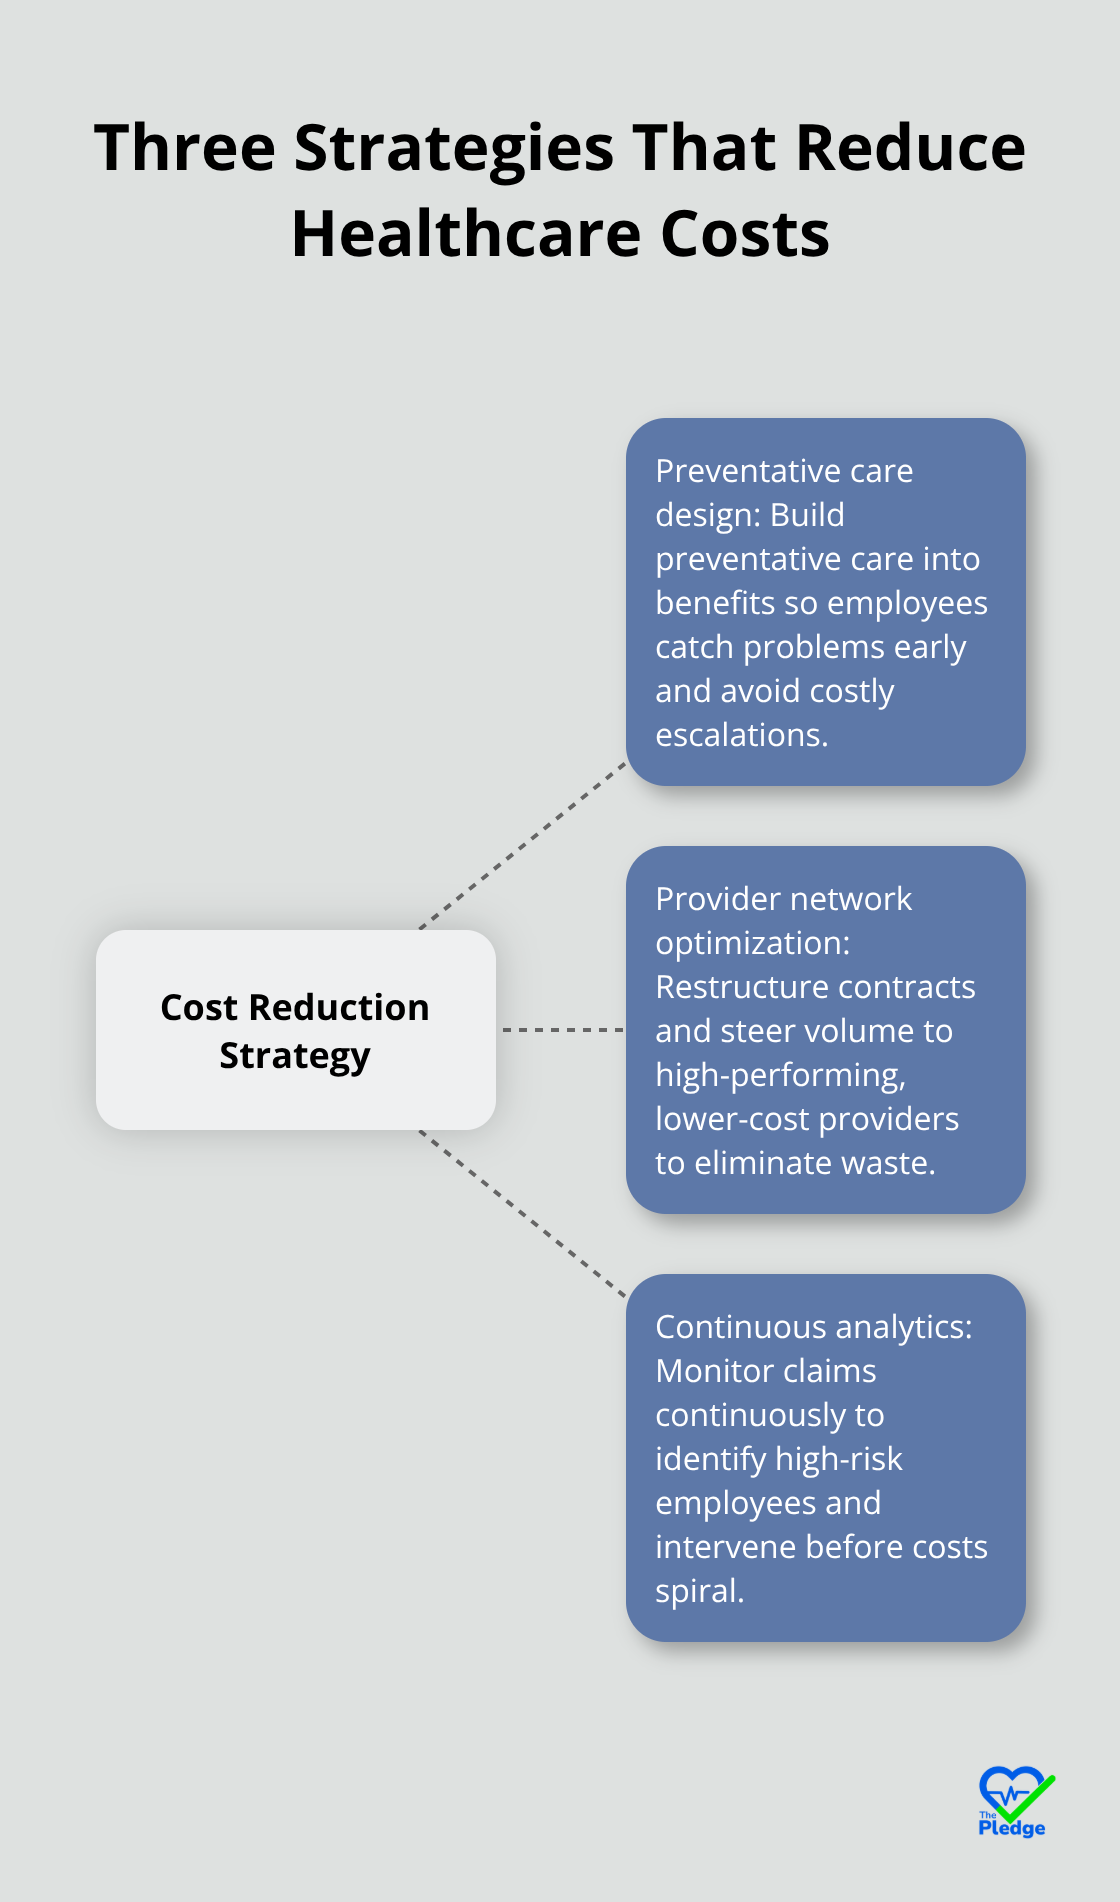
Data reveals cost drivers, but data alone doesn’t lower bills. Organizations that succeed translate insights into concrete interventions that address root causes, not symptoms. Three interconnected strategies move the needle: building preventative care into your benefits design so employees catch problems early, restructuring how you contract with providers to eliminate waste in your network, and using continuous analytics to identify which employees need help before costs spiral. These aren’t sequential steps-they work together, and the organizations that implement all three simultaneously see the fastest financial returns.
Prevention Works When You Design It Into Incentives
Preventative care programs fail in most organizations because they’re optional add-ons rather than central to how benefits work. The data shows why: ninety percent of healthcare spending concentrates on people with chronic conditions, which means your return multiplies when you catch disease early. Organizations that restructure their benefits to reward preventative visits-zero-cost primary care, subsidized screenings for high-risk employees, covered medications for chronic disease management-see measurable shifts in utilization within six months.
A healthcare organization that invested in removing cost barriers to preventative care for diabetic employees found that employees who completed annual eye and foot exams reduced emergency room visits by thirty-five percent within eighteen months, translating to roughly two thousand dollars saved per employee annually. The key is specificity: don’t fund generic wellness programs. Fund screenings and preventative services for the conditions your claims data showed are driving your costs. If your spending concentrates on cardiovascular disease, subsidize stress testing and lipid panels. If diabetes dominates your claims, cover continuous glucose monitors and dietitian visits. This precision transforms prevention from feel-good theater into a financial lever.
Provider Network Optimization Cuts Waste Faster Than Most Realize
Your provider network likely contains redundancy and inefficiency that your contracts never addressed. Organizations typically negotiate rates with dozens of hospitals and hundreds of specialists without understanding which providers actually deliver better outcomes or lower costs. Start by analyzing which providers your employees use most frequently and which generate the highest claims. Then audit whether those high-cost providers deliver better outcomes-measured by complication rates, readmission rates, and patient satisfaction-or simply charge more.
Consolidate volume toward high-performing, lower-cost providers and renegotiate rates with your top fifteen to twenty facilities and physician groups. Provider network optimization eliminates waste through strategies that aim to provide high quality care at low costs. Beyond rates, optimize your network design: if your employees travel long distances to access care, that friction increases no-shows and delayed care, which drives emergency visits. Regional health systems and employers that redesigned their networks to place urgent care clinics and primary care centers closer to employee populations saw primary care utilization increase by twenty to thirty percent while emergency room visits fell.
The financial impact compounds: primary care visits cost roughly one hundred fifty dollars, while emergency room visits average over one thousand dollars for similar complaints. Establish clear service-level agreements with your top providers that specify response times, quality metrics, and outcomes. Organizations that implement weekly scorecards and monthly performance reviews with their largest provider partners-as Starbucks did during its supply chain transformation-maintain accountability and catch service degradation before it impacts employee satisfaction or costs.
Continuous Analytics Identifies Risk Before Costs Explode
Your initial claims analysis gave you a snapshot, but cost drivers shift quarterly as employees age, change jobs, or develop new conditions. Organizations that automate ongoing analytics to identify high-risk populations month-to-month catch preventable escalations before they generate expensive acute care. Use your claims data to build simple risk segments: employees with multiple chronic conditions, those with recent emergency room visits, pregnant employees, and post-surgical patients all benefit from targeted outreach and care coordination.
When you identify an employee in a high-risk segment, assign a care coordinator or nurse hotline to check in regularly, ensure medication adherence, schedule preventative screenings, and connect them to specialists before problems worsen. Sunsweet Growers improved forecasting accuracy by fifteen to twenty percent and cut production overtime by seventy-five percent through demand-planning software that continuously monitored inventory and consumption patterns-a parallel to how healthcare organizations use continuous analytics to monitor health trajectories. The financial payoff is direct: employees with poorly controlled diabetes who receive regular outreach from a care coordinator reduce hospitalizations by forty to fifty percent, saving three thousand to five thousand dollars per employee annually. The investment in a care coordination program-roughly one hundred to two hundred dollars per high-risk employee annually-pays back within months for employees with serious chronic illness.
These three strategies create a foundation for measurable cost reduction, but their impact depends on how well you measure and track results. The next section shows you how to set metrics that matter and calculate the ROI that justifies your investment.
How to Measure What Actually Matters
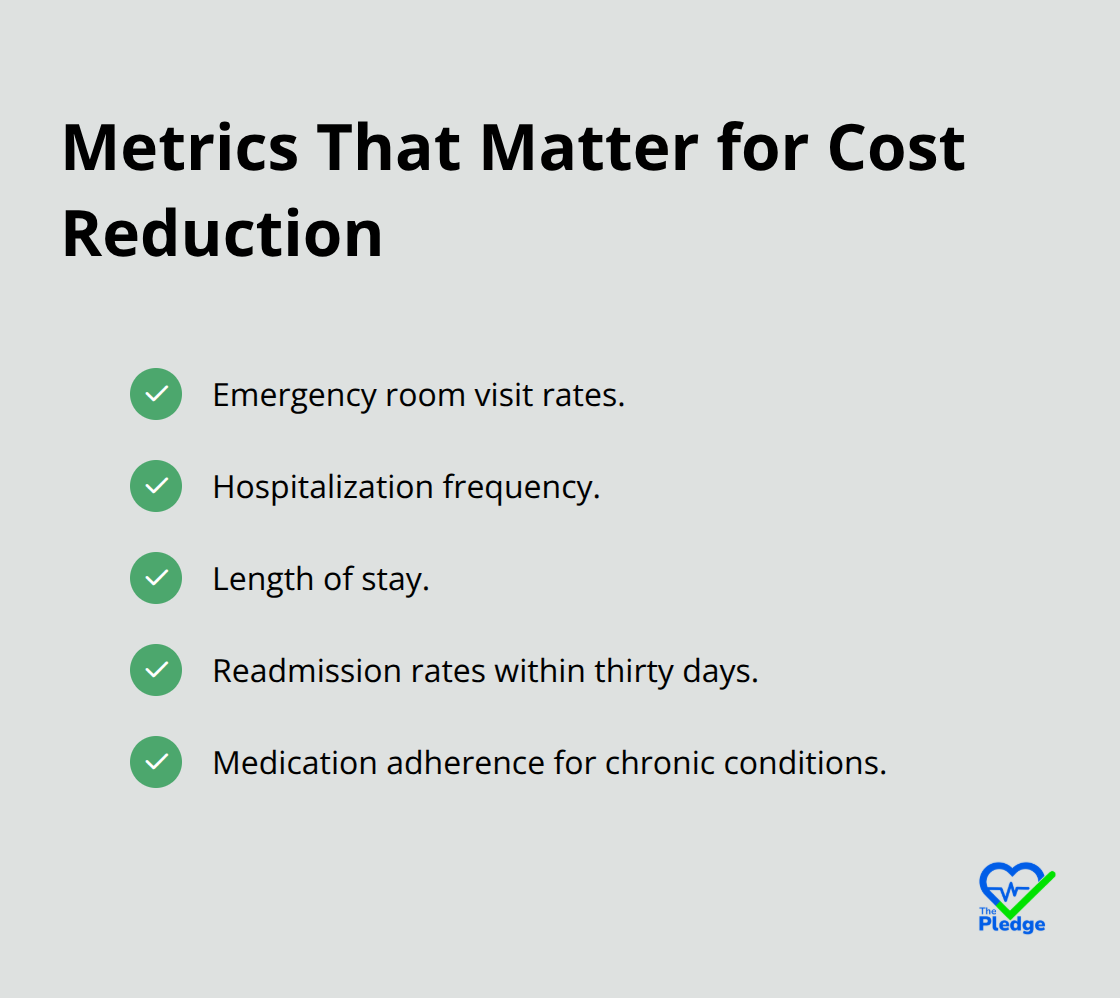
Most healthcare organizations measure the wrong things and miss the financial impact staring them in the face. They track wellness program enrollment, gym membership sign-ups, and health fair attendance-metrics that feel good but rarely correlate with cost reduction or ROI. Organizations waste years collecting vanity metrics while their actual cost drivers remain untouched. Before you implement a single intervention, define the metrics that connect directly to your financial goals: emergency room visit rates, hospitalization frequency, length of stay, readmission rates within thirty days, and medication adherence for chronic conditions. These metrics matter because they drive claims costs. A thirty percent reduction in emergency room visits for a five-thousand-person organization saves roughly one million dollars annually, assuming average emergency room costs of one thousand dollars per visit.
Set Baselines and Track Monthly
Set baseline measurements from your claims data before implementation, then track these metrics monthly, not quarterly or annually. Monthly tracking reveals whether your interventions work within weeks, not months. If an initiative doesn’t move the needle within ninety days, kill it and redeploy resources elsewhere. This discipline separates organizations that achieve real cost reduction from those that chase trends. Your finance team should receive monthly reports showing progress against each metric. When leadership sees that emergency room visits dropped from four hundred to three hundred in a single month, that visibility drives accountability and sustains momentum.
Correlate Engagement With Claims Outcomes
Engagement metrics matter, but only if they predict cost reduction. Track which employees use your preventative care programs, which complete health risk assessments, and which enroll in care coordination for chronic conditions. Then correlate engagement with claims outcomes six months later. Organizations that implement this discipline find that employees who complete health risk assessments and enroll in condition-specific programs reduce claims costs by fifteen to twenty-five percent compared to non-engaged peers. That correlation becomes your proof point.
Calculate cost savings by comparing actual claims spending for engaged employees against a control group of non-engaged employees matched by age, condition, and baseline spending. If engaged employees with diabetes reduce emergency room visits from four per year to two per year, that’s two thousand dollars in savings per employee annually. Multiply that by your number of engaged employees with diabetes, subtract the cost of your care coordination program, and you have your ROI.
Calculate ROI With Precision
A care coordination program costing two hundred dollars per employee annually delivers positive ROI if it reduces emergency room visits by just two visits per year for employees with serious chronic illness. Industry benchmarks show that high-performing cost reduction initiatives in healthcare deliver 200 to 350 percent ROI within twelve months when measured correctly. Try a target of at least 150 percent ROI within the first year-if your program doesn’t hit that threshold, it’s underperforming.
Build a simple spreadsheet that calculates monthly ROI by comparing total program costs against total claims cost reductions for engaged employees. Share this spreadsheet with your finance team and leadership quarterly. Organizations that maintain this discipline sustain cost reduction programs because the ROI becomes undeniable and resources flow to initiatives that work. The formula is straightforward: ROI = (Cost Savings − Program Investment) / Program Investment × 100. Track this number obsessively and adjust your programs based on what the data shows.
Final Thoughts
The path to cost savings plus measurable ROI in healthcare demands discipline, not complexity. Organizations that succeed start by analyzing their actual spending patterns through detailed claims data, implement targeted interventions that address root causes rather than symptoms, and track financial impact with precision. The three-part strategy-preventative care design, provider network optimization, and continuous risk analytics-works because it aligns financial incentives with health outcomes.
Organizations that achieve the fastest cost reduction act immediately with the data they have and adjust based on monthly results. A 150 percent ROI within the first year remains achievable for most healthcare organizations that implement these strategies with focus and accountability. That means a two-hundred-dollar investment per employee in care coordination generates three hundred dollars in claims savings within twelve months, and your provider network optimization compounds those gains further.
As your preventative care programs mature and your provider network stabilizes around high-performing partners, cost growth slows while health outcomes improve. Extract your claims data this month, benchmark against industry standards, and identify your top three cost drivers, then pilot a targeted intervention with your highest-cost population. The Pledge integrates seamlessly with your existing benefits to drive the preventative care model and real-time analytics that cost reduction demands.
![Navigating Your Provider Network for Maximum Savings [Guide]](https://thepledge.app/wp-content/uploads/emplibot/Navigating-Your-Provider-Network-for-Maximum-Savings-_Guide__1781489382-300x168.jpeg)